1. A Fast, Readable Option Chain
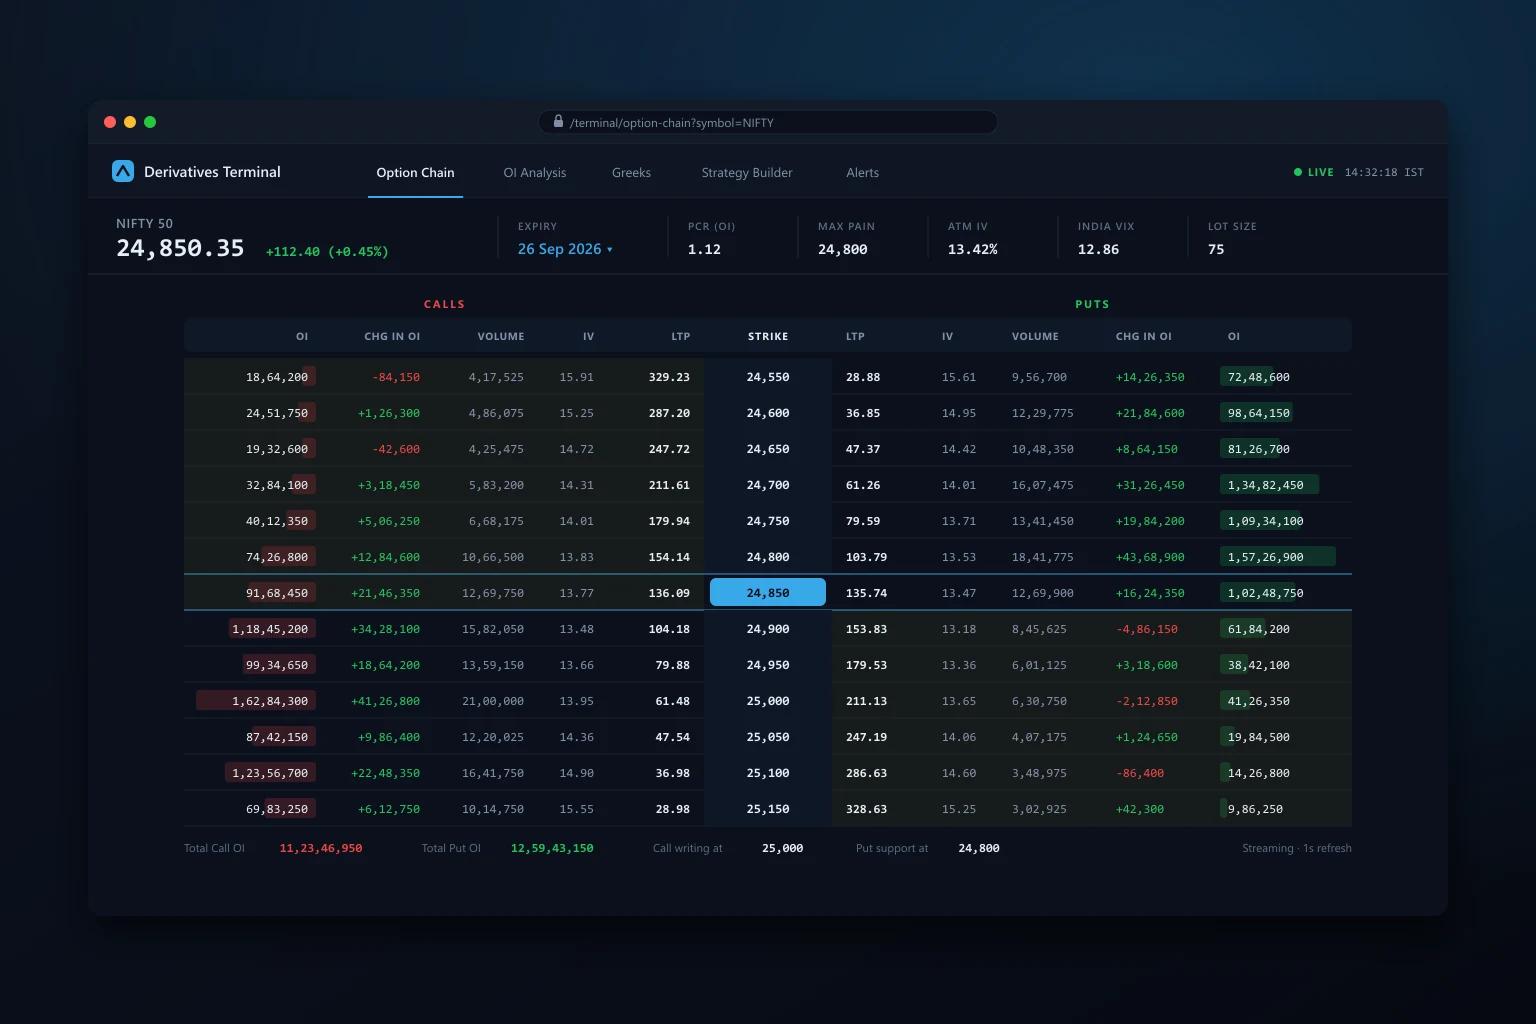
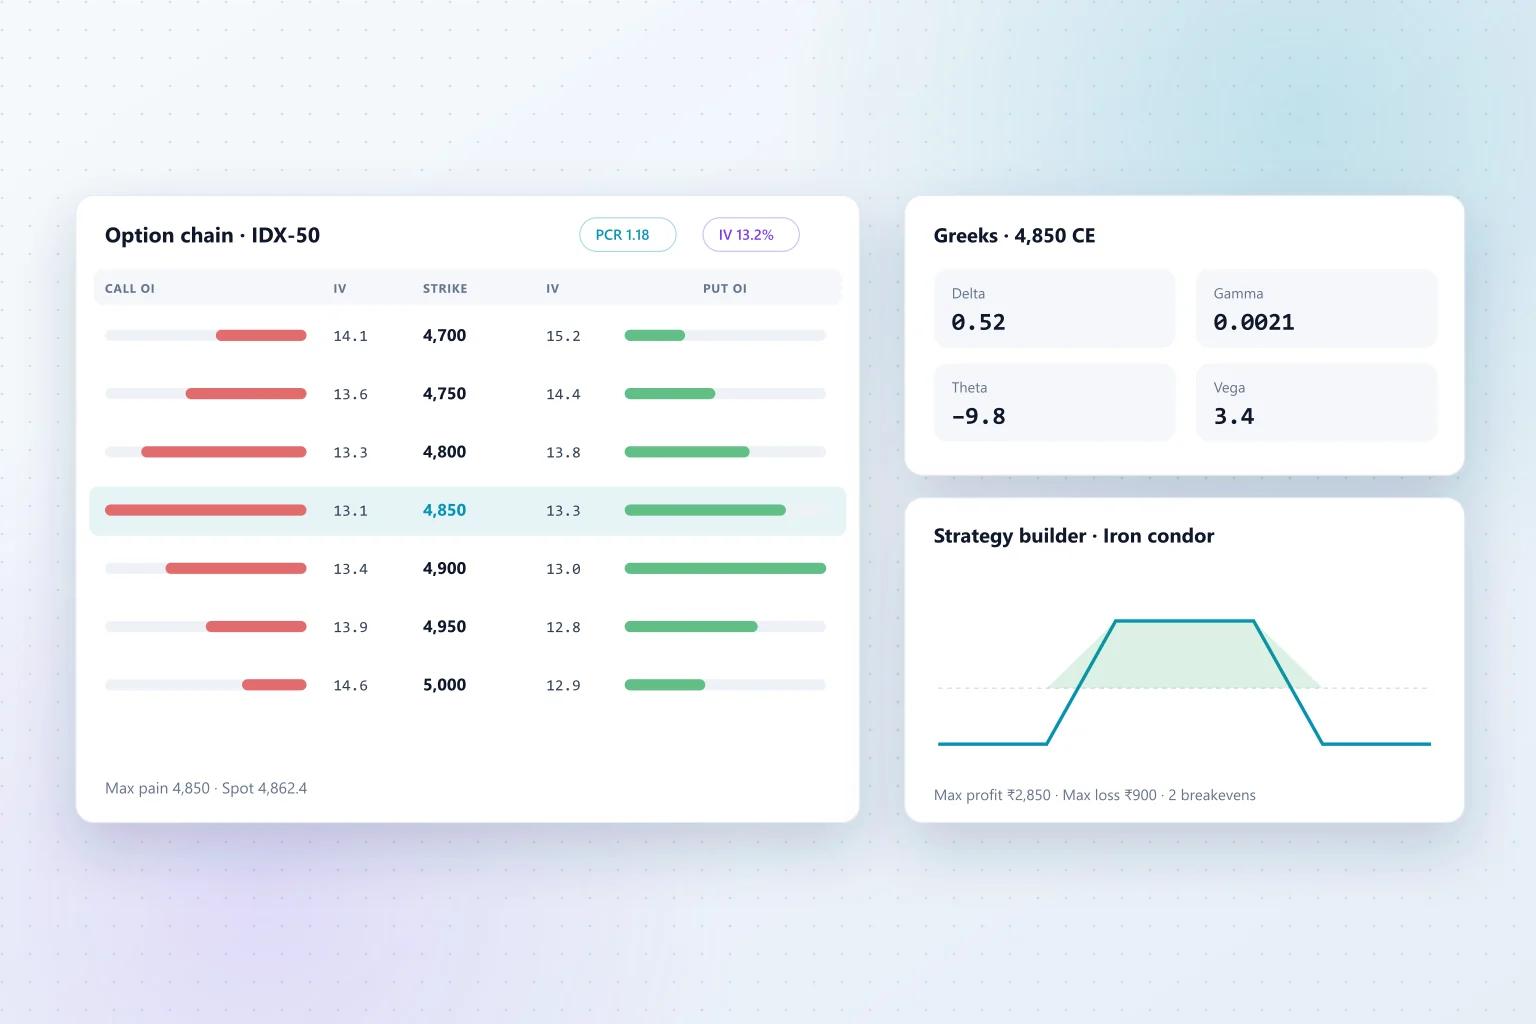
The option chain is the centre of any options tool. Calls and puts sit side by side around the strike, with last price, change, volume, open interest, change in open interest and implied volatility for each contract. The at-the-money strike should be highlighted and the chain should update in real time without the page jumping around.
Visual cues such as open interest bars make it easy to spot where positions are concentrated, which traders use to judge support and resistance levels.
2. Open Interest Analysis
Open interest shows how many contracts are outstanding. Changes in open interest, read together with price, help traders understand whether new positions are being built or existing ones closed.
Open interest views traders rely on
Change in OI by strike: Where new positions are being added or unwound during the day.
Put-Call Ratio (PCR): Total put open interest divided by total call open interest, used as a sentiment indicator.
Max pain: The strike at which option buyers' combined payout would be lowest at expiry.
OI build-up classification: Long build-up, short build-up, short covering and long unwinding, based on price and OI changes together.
3. Implied Volatility and the Greeks
Implied volatility tells traders whether options are relatively cheap or expensive. Showing IV alongside its historical range, as an IV percentile or IV rank, gives that number context. The Greeks (delta, gamma, theta and vega) describe how an option's price reacts to movement in the underlying, time and volatility, and are essential for managing multi-leg positions.
Calculating Greeks accurately for every strike in real time requires efficient pricing models and careful handling of interest rates, dividends and time to expiry.
4. Strategy Builder With Payoff Charts
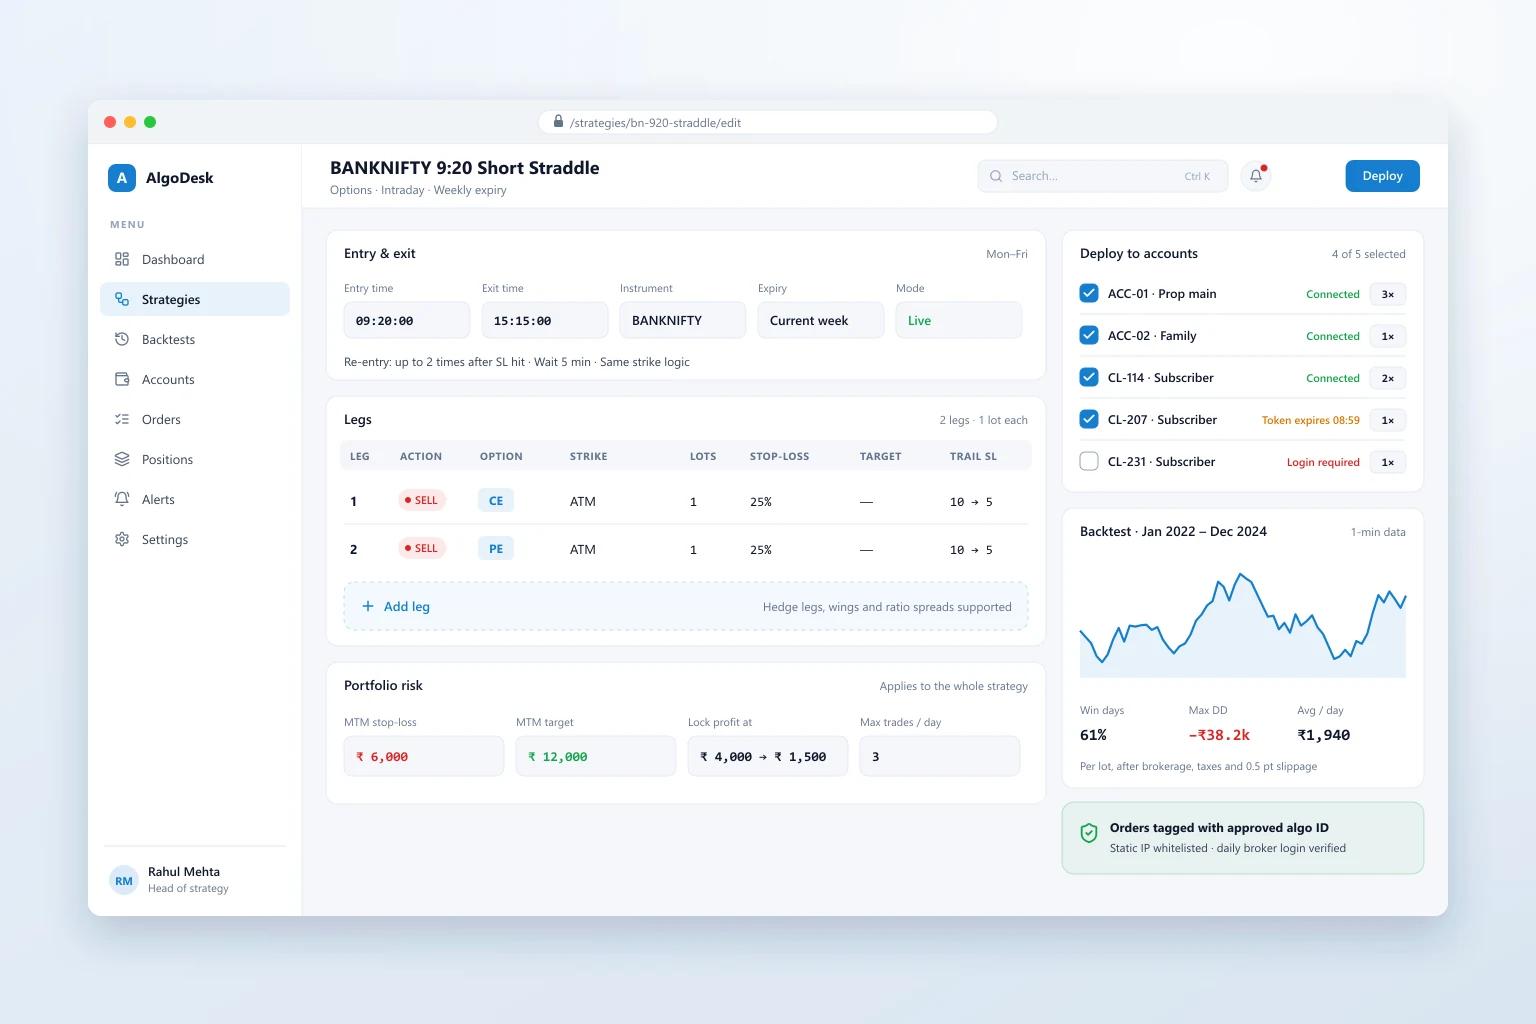
A strategy builder lets traders combine legs, such as spreads, straddles, strangles and iron condors, and see the payoff at expiry and before expiry. It should show maximum profit, maximum loss, breakeven points and margin estimates, and let users adjust strikes, quantities and expiries interactively.
5. Scanners, Screeners and Alerts
Traders cannot watch every strike and underlying at once. Scanners find setups automatically, for example unusual open interest build-up, IV spikes or large changes in PCR, and alerts notify users on web, mobile or Telegram when conditions are met.
6. Historical Data and Backtesting
Historical option chain data lets traders study how open interest and volatility behaved around past events and expiries, and test options strategies before trading them. Storing this data efficiently, often as snapshots at regular intervals through the day, is a significant engineering task on its own.
7. Performance and Data Licensing
Options data is large and fast-moving. Real-time delivery over WebSockets, efficient rendering on the client and a backend that can compute analytics for many underlyings at once separate a professional tool from a slow one.
Real-time exchange data must come from a licensed source, such as your broker or an authorised data vendor, and display rules vary by licence. Planning the data source and licensing early avoids expensive changes later.
8. Conclusion
The best options analytics tools combine accurate data, fast calculation and a clean interface that helps traders decide quickly. Every feature above is valuable on its own; together they make a platform traders open every morning.
Accel Fintech builds option chain analytics, strategy builders, open interest tools and market data platforms for traders and brokers. Explore our stock market tools service or our option chain case study to see what we have built.